
Large sites, many feeders, one view.
Shipyards and railway workshops spread across large sites, with dozens of feeders, and cranes, compressors and welding sets that draw power wherever the work is. BOX2M meters every feeder from the substation down without stopping production, measures new areas with mobile audit kits, and puts it all on one time axis in the cloud.
Big sites, moving loads, old switchgear.
Hectares, not a hall
Docks, workshops and yards far apart, with power, air and water run over long distances.
Many feeders, one bill
Dozens of feeders and sub-boards, and a monthly bill that doesn't say which one drew the power.
Loads that move
Cranes, welding sets and compressors start and stop as work moves around the site, and the peaks follow.
Old and new side by side
Decades of switchgear, meters and signals, and often no cable to the far corners of the site.
What BOX2M measures, area by area.
From the substation to the dock. Every area feeds the same data model in the cloud.
Substations and feeders
kWh · kW · kvarh · PQMV and LV substations, feeder by feeder, with power quality and alarms.
Cranes and handling
kWh · kW · run timeGantry and overhead cranes, conveyors and lifts: energy and run time per machine.
Workshops and welding
kWh · kW · run timeCutting, welding and machining bays, per sub-board and per shift.
Compressed air
Nm³ · bar · kWhFlow and pressure at the compressors and headers, energy per compressor.
Docks, yards and depots
kWh · m³ · signalsDock pumps, shore supplies, water and lighting, over our own radio network where there is no cable.
Environment
PM · emissions · °C · %RHParticles and emissions near blasting, painting and welding, next to production data.
Six things shipyards and heavy industry do with BOX2M.
Every feeder, from the substation down
0.4 kV to 110/220 kV, feeder by feeder, with power quality, peaks and alarms.
ApplicationRun time per crane and machine
Running cycles, run time, idle time and starts per machine and shift. The basis for predictive maintenance.
ApplicationCompressed air: leaks and idle running
Flow and pressure at the compressors, run time per machine, alarms when the site is idle and air still flows.
ApplicationAudit a dock before you invest
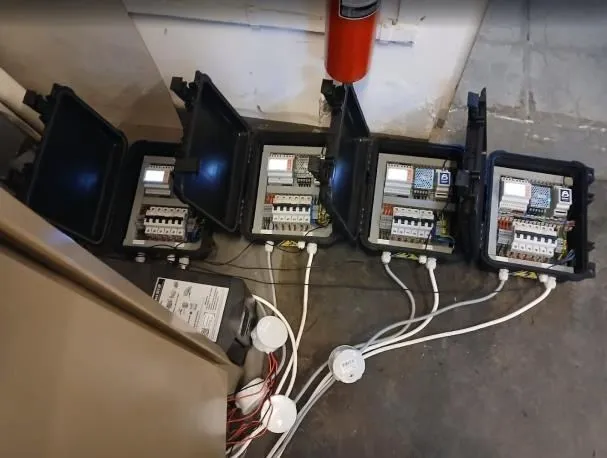
Mobile electrical and water kits measure a dock, a workshop or a new line for two weeks, then move on. No power cut.
ApplicationSignals from every corner
Our own radio and cable networks collect meters and signals across the whole site. Old relays and contacts are digitised.
ApplicationParticles and emissions
Emissions, air particles and ambient conditions near workshops and paint shops, with alarms.
ApplicationThe numbers a yard runs on.
Per feeder, per area, per machine and per shift, updated every minute in the cloud and reported in PDF or CSV. The same data goes to your ERP, maintenance system or SCADA over API.
Example values for a demo site.
Yards, docks and depots.
Tell us about your site.
A single-line diagram, or a list of your substations and feeders, is enough to start. One of our engineers answers within one business day.