
Feeders, peaks and power quality.
Wire, fence and profile plants draw heavy, uneven loads from their own substations: furnaces, drawing lines, welders and presses. BOX2M reads every feeder without stopping production, sends the data to the cloud and turns it into peaks, power quality, and cost and CO₂ per tonne.
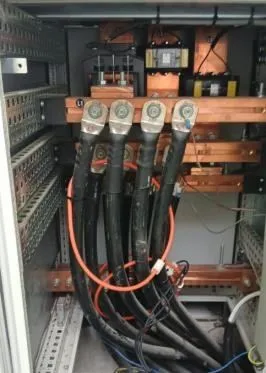
Heavy loads, old boards, one contract.
Peaks set the bill
Furnaces, presses and welders starting together push demand over the contracted power.
Power quality
Furnaces, drives and welders distort the supply and draw reactive power that shows up on the bill.
Old boards, few meters
Substations and main boards from decades ago, with analogue meters or none at all.
Cost and CO₂ per tonne
Customers and banks ask for energy and carbon per tonne of wire, mesh or profile.
What BOX2M measures, from substation to dispatch.
From the grid connection to the finished coil or profile. Every stage feeds the same data model in the cloud.
Substation and feeders
kWh · kW · kvarh · PQMV/LV substations and main feeders, from 6/10/20 kV down to 0.4 kV.
Furnaces and ovens
kWh · kW · m³ · °CInduction, annealing and billet heating: electricity and gas per furnace.
Drawing, forming and extrusion
kWh · kW · run timeEnergy and run time per drawing line, roll former or extrusion press.
Welding and coating
kWh · run time · m³Mesh welders, galvanising baths and coating lines: electricity and gas per line and shift.
Cooling water and compressed air
m³/h · °C · Nm³ · barCooling circuits read with clamp-on meters, compressors at the headers.
Cranes and facility systems
kWh · run timeOverhead cranes, conveyors, HVAC and lighting on their own sub-meters.
Six things steel and aluminium plants do with BOX2M.
Every feeder, every minute
Substation monitoring from 0.4 kV up to 110/220 kV, feeder by feeder, with 1-minute data.
ApplicationPeaks under watch
Peaks and deviations raise an alarm by email, SMS, WhatsApp or voice call. Chosen loads switch manually or by playbook.
ApplicationPower quality per feeder
Power quality and reactive energy per feeder, in PDF and CSV reports from the platform.
ApplicationOld meters, new data
Existing meters and analysers read as they are. Relays, contacts and analogue signals digitised.
ApplicationCooling water without pipe cuts
Clamp-on ultrasonic probes on cooling circuits for flow, temperature and velocity.
ApplicationAudit before you invest
Electrical kits with split-core transducers up to 4000 A measure a furnace or a line without a power interruption, before you change the supply contract.
ApplicationThe numbers a steel or aluminium plant runs on.
Per tonne, per feeder and per shift, updated every minute in the cloud and reported in PDF or CSV. The same data goes to your ERP, MES or maintenance system over API.
Example values for a demo plant.
From wire to profile.
Tell us about your plant.
A single-line diagram of your substation and main feeders is enough to start. One of our engineers answers within one business day.