
Power, backup and cooling, site by site.
Tower sites, shelters and data centres are spread out, mostly unmanned and expected never to stop. BOX2M reads the grid supply, the DC system, generators and air conditioning at every site, and sends the data to the cloud over cellular or satellite, independent of the site's own network. Alarms reach the right person, with acknowledgement.
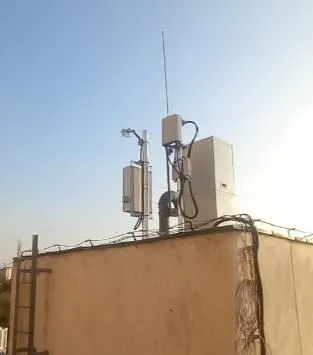
Many sites, few visits, no downtime.
Many sites, nobody on site
Towers and shelters spread across a country, visited when something has already failed.
Energy paid site by site
Grid bills, diesel and cooling for every site, often estimated and checked late.
Backup that has to work
Batteries and generators prove themselves only in an outage, unless someone watches them every day.
Audited under NIS2
Network and data-centre operators, and their suppliers, must show how their systems are monitored and secured.
What BOX2M measures, stage by stage.
From the grid supply to the equipment it keeps running. Every site feeds the same data model in the cloud.
Grid supply
kWh · kW · V · PQEnergy, voltage and power quality at the site's supply, from 0.4 kV up.
DC system and batteries
V · alarmsDC system voltage, with rectifier and battery alarms read as contacts.
Generator
run time · startsRun time and starts per generator, its alarms read as contacts. TO CONFIRM: fuel level in the generator tank
Cooling
kWh · °C · %RHAir-conditioning energy, room temperature and humidity. Units switched on a schedule, PIN-protected.
Equipment load
kWh · kWEnergy per operator, tenant or rack circuit.
Link to the cloud
cellular · LoRa · satelliteMØ on a DIN rail, −40 to +85 °C, on 230 V AC or a 48 V DC supply. Any cellular operator, or Iridium and Starlink where there is no coverage.
Six things network and data-centre operators do with BOX2M.
Every site on one screen
Grid, DC system, generator and cooling from every site in one data model. Devices that stop reporting raise an alarm too.
ApplicationGrid supply and power quality
Energy, voltage and power quality at the supply, from 0.4 kV sub-boards to the substation, with alarms.
ApplicationEnergy per tenant on shared sites
Each operator, tenant or rack circuit metered and billed against contractual maximums.
ApplicationOld alarms, digitised
Rectifier, generator and air-conditioning alarms read as relays and contacts, without replacing the equipment.
ApplicationCooling under watch
Room temperature, humidity and air-conditioning energy, with alarms by email, SMS, WhatsApp and voice call.
ApplicationSites without coverage
Iridium and Starlink links for isolated sites, and as backup monitoring when the cellular network is down.
ApplicationThe numbers a site network runs on.
Per site, per tenant and per day, updated every minute in the cloud and reported in PDF or CSV. The same data goes to your maintenance, WFM or ERP system over API.
Example values for a demo tower site and data centre.
Across the network.
Tell us about your sites.
A list of your site types and what runs on them, or a single-line diagram, is enough to start. One of our engineers answers within one business day.